SP500 LDN TRADING UPDATE 17/3/26

SP500 LDN TRADING UPDATE 17/3/26
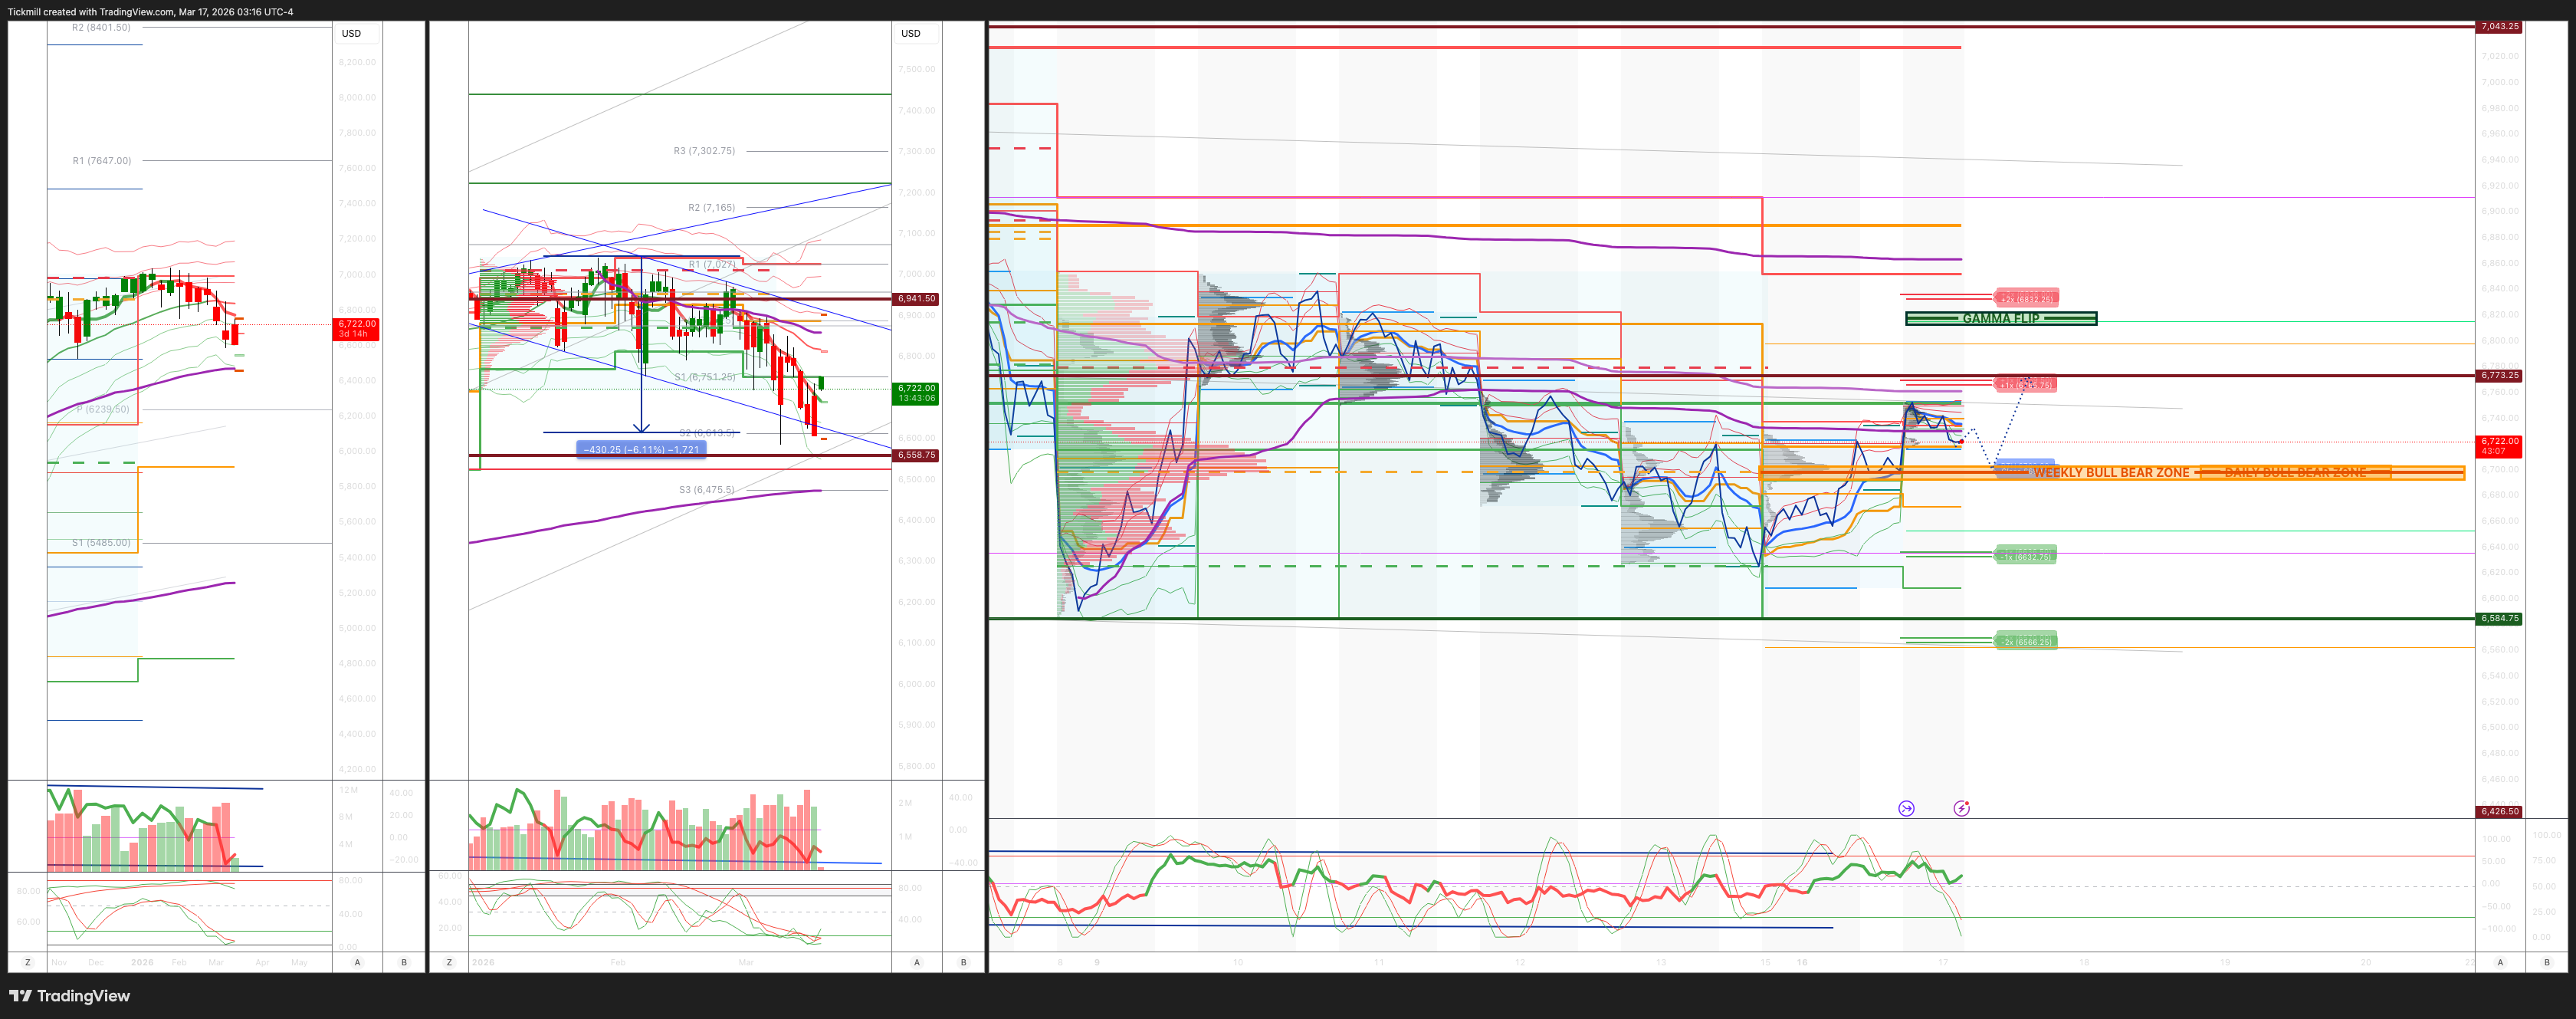
***QUOTING ES1! FOR CASH US500 EQUIVALENT LEVELS, SUBTRACT POINT DIFFERENCE***
WEEKLY BULL BEAR ZONE 6700/10
WEEKLY RANGE RES 6825 SUP 6426
Weekly Straddle Range: 199 -point straddle implies a weekly range of [6426, 6824]; monitor 1.5x and 2x moves for key reactions.
March OPEX Straddle: 232.8-point range suggests OPEX-to-OPEX movement between [6677, 7142].
March QOPEX Straddle: 368.55-point range projects [6466, 7203], based on December OPEX.
March EOM Straddle: 255.4-point straddle indicates a monthly range of [6623, 7101]. .
DEC2025 to DEC2026 OPEX straddle spans 945 points, outlining a range of [5889, 7779]."
DAILY VWAP BULLISH 6688
WEEKLY VWAP BEARISH 6777
MONTHLY VWAP BEARISH 6869
DAILY STRUCTURE – BALANCE - 6818/6627
WEEKLY STRUCTURE – OTFD - 6852
MONTHLY STRUCTURE - OTFD
Balance: This refers to a market condition where prices move within a defined range, reflecting uncertainty as participants await further market-generated information. Our approach to balance includes favouring fade trades at the range extremes (highs/lows) while preparing for potential breakout scenarios if the balance shifts.
One-Time Framing Higher (OTFH): This represents a market trend where each successive bar forms a higher low, signalling a strong and consistent upward movement.
One-Time Framing Lower (OTFD): This describ@es a market trend where each successive bar forms a lower high, indicating a pronounced and steady downward movement.
DAILY BULL BEAR ZONE 6710/00
GAMMA FLIP 6821
DAILY RANGE RES 6769 SUP 6636
2 SIGMA RES 6836 SUP 6570
VIX BULL BEAR ZONE 20
PUT/CALL RATIO 1.25 (The numbers reflect options traded during the current session. A put-call ratio below 0.7 is generally considered bullish, and a put-call ratio above 1.0 is generally considered bearish)
TRADES & TARGETS
LONG ON REJECT/RECLAIM DAILY BULL BEAR ZONE TARGET DAILY RANGE RES
(I FADE TESTS OF 2 SIGMA LEVELS ESPECIALLY INTO THE FINAL HOUR OF THE NY CASH SESSION AS 90% OF THE TIME WHEN TESTED THE MARKET WILL CLOSE ABOVE OR BELOW THESE LEVELS)
GOLDMAN SACHS TRADING DESK VIEW - ‘Broad Rally’
S&P closed up 101 bps at 6,699 with a Market-On-Close (MOC) imbalance of $1 billion to sell. NDX gained 113 bps to close at 24,655, R2K rose 109 bps to 2,507, and the Dow added 83 bps to finish at 46,946. Trading volume was 17.4 billion shares across all U.S. equity exchanges, below the year-to-date daily average of 19.57 billion shares. The VIX dropped 13% to 23.57, WTI Crude fell 5% to $93.71, the U.S. 10-Year Treasury yield declined 5 bps to 4.21%, gold slipped 88 bps to $5,017, the DXY weakened 57 bps to 99.79, and Bitcoin surged 304 bps to $73,920.
Equities broadly advanced today, supported by slightly lower oil prices, discussions around a potential coalition to reopen the Strait of Hormuz, and anticipation for Nvidia’s GTC conference (running through Thursday). Nvidia rallied sharply following CEO Jensen Huang’s comments that he expects the company’s revenue to double to $1 trillion by 2027. Market breadth was strong, with over 75% of S&P components finishing in positive territory. As Tony P highlighted, the current trading environment is prone to volatility in both directions, which was evident in today’s price action. Investor sentiment toward Nvidia remains relatively upbeat compared to other "Magnificent 7" stocks, with the recent de-rating providing some downside protection. Many investors continue to view Nvidia as a beat-and-raise story, particularly given its expanding platform reach.
Activity levels on our floor were moderate, rated a 4 on a scale of 1 to 10. The floor ended the session up 255 bps to buy, well above the 30-day average of +35 bps. Long-only funds were slight net sellers, driven by supply in industrials offset by demand in energy, while hedge funds were slight net buyers, particularly in macro products. Mutual fund activity remained subdued as investors appeared cautious amidst elevated uncertainty, opting to stay on the sidelines for now. Hedge fund net exposures are declining, with prime equities seeing net selling for the fourth consecutive week, placing the net level in the 69th percentile over the past year. Macro hedge activity surged at one of the fastest rates on record, partially offset by modest single-stock net buying, largely driven by short covering in TMT. ETF activity remained robust, marking an unprecedented 11th consecutive session with ETFs accounting for over 35% of trading volume. S&P top-of-book liquidity remains low, ending the day at $3.98 million.
Systematic strategies have reportedly sold approximately $80 billion in global equities over the past month. Projections indicate another $70 billion in sales over the next week and $100 billion over the next month, with U.S. markets likely to bear a disproportionate share due to increasingly negative trend signals. While a significant portion of mechanical de-risking has already occurred, additional selling pressure is anticipated.
In derivatives, flows started the day quietly but picked up as large hedges were initiated in the S&P. Volatility was hit hard at the open, particularly in short-dated topside options, as the market rallied. There was limited appetite to chase gains via high implied volatility calls. The aggressive repricing of volatility may be linked to Wednesday’s VIX expiry, given the recent high realized volatility of volatility. Over the weekend, the vol panic index touched 9.54/10, indicating persistent internal stress. Despite this, last week saw one of the sharpest repricings of S&P 1-month put-call skew in recent years. The desk views the NDX as a favorable space for options, given that front-end volatility appears low relative to the SPX. Additionally, we prefer longer-dated downside hedges (~6-month 25-delta puts) in the S&P. The straddle for the remainder of the week priced at approximately 1.98%.
Disclaimer: The material provided is for information purposes only and should not be considered as investment advice. The views, information, or opinions expressed in the text belong solely to the author, and not to the author’s employer, organization, committee or other group or individual or company.
Past performance is not indicative of future results.
High Risk Warning: CFDs are complex instruments and come with a high risk of losing money rapidly due to leverage. 72% and 73% of retail investor accounts lose money when trading CFDs with Tickmill UK Ltd and Tickmill Europe Ltd respectively. You should consider whether you understand how CFDs work and whether you can afford to take the high risk of losing your money.
Futures and Options: Trading futures and options on margin carries a high degree of risk and may result in losses exceeding your initial investment. These products are not suitable for all investors. Ensure you fully understand the risks and take appropriate care to manage your risk.
Patrick has been involved in the financial markets for well over a decade as a self-educated professional trader and money manager. Flitting between the roles of market commentator, analyst and mentor, Patrick has improved the technical skills and psychological stance of literally hundreds of traders – coaching them to become savvy market operators!